The First Detection of the Madden-Julian Oscillation Signal in a Natural Archive
【Release time:29-Jan-2021
】【Data source:IEECAS】
The Madden-Julian oscillation (MJO) is the most prominent mode of intraseasonal variability in the tropical and even global climate system, with quasi-oscillating periods of 30-90 days.
Complex interactions between the MJO and other weather/climate processes have been described by the modern instrumental data and mode simulation over the past half century, including the onsets and breaks of the Asian-Australian monsoon, the evolution of El Ni?o/La Ni?a, tropical cyclones, tropical diurnal cycles, extreme precipitation events, North Atlantic Oscillation, and more.
Because the MJO represents an important source of predictability on sub-seasonal time scales. Its variability over longer time scales and its changes with the increasing background temperature are very important for predicting the future climate anomalies and variability under global warming scenarios.
However, due to the short time-span of the modern instrumental data, initiation and the long-term variability of MJO are still unclear, which limits our understanding of the tropical atmosphere and our ability to simulate and predict its variability.
Recently, the research team led by Prof. YAN Hong, from the Institute of Earth Environment (IEE) of the Chinese Academy of Sciences, found that daily to hourly resolution biological and geochemical proxy records could clearly record MJO variability in the tropics. Significant MJO periods were detected from the daily growth rate (DGR), hourly Fe/Ca and fluorescence intensity time series.
The connection between the daily growth rate and MJO was possibly linked through the local effective solar radiation, while the connections between the Fe/Ca, fluorescence intensity and MJO were possibly linked through the local wind speed intensity and associated vertical mixing in the upper ocean.
This was the first record to detect the MJO signal from a natural paleoclimate archive. Our results provided a tool with the potential to study the MJO beyond the instrumental records. Fossil Tridacna shells from beyond the period of instrumental records might be used to investigate a fuller range of variability of MJO activity.
The study was recently published in Earth and Planetary Science Letters. This work was supported by the projects from the National Science Foundation of China and the Chinese Academy of Sciences.
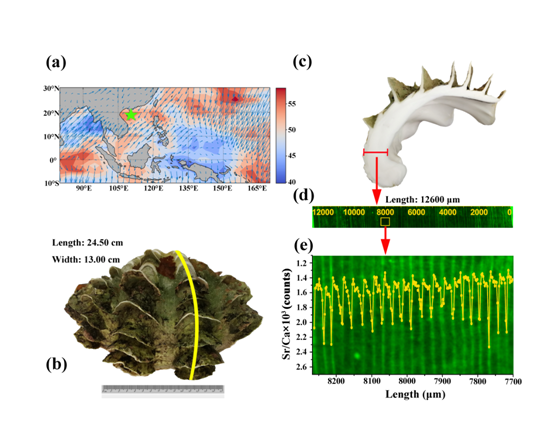
Fig.1 Sample collection and analysis.(a) The location of the sampling site (Green star; 17°05' N, 111°30' E; North Reef of the South China Sea). The base map shows the standard deviation of daily OLR (less than 90-day high-pass filtering) during northern late summer and early autumn (July to October) of 2011-2013. The red color in base map shows the region with strong MJO activity. Arrows show summer mean 1000-hPa wind speed and direction. (b) The shell sample Tridacna deresa XB10. (c) Shell section from maximum growth axis. The channel for LSCM and Nano-SIMS analysis was marked in red. (d) The auto-fluorescence micro-image of the sample during the 12.6 mm growth lifetime obtained by LSCM. The Nano-SIMS analysis was also performed on the whole 12.6 mm. (e) The one to one match between the daily growth bands and the Sr/Ca daily cycles from 7700 to 8250 μm. (Imaged by YAN Hong, et al)
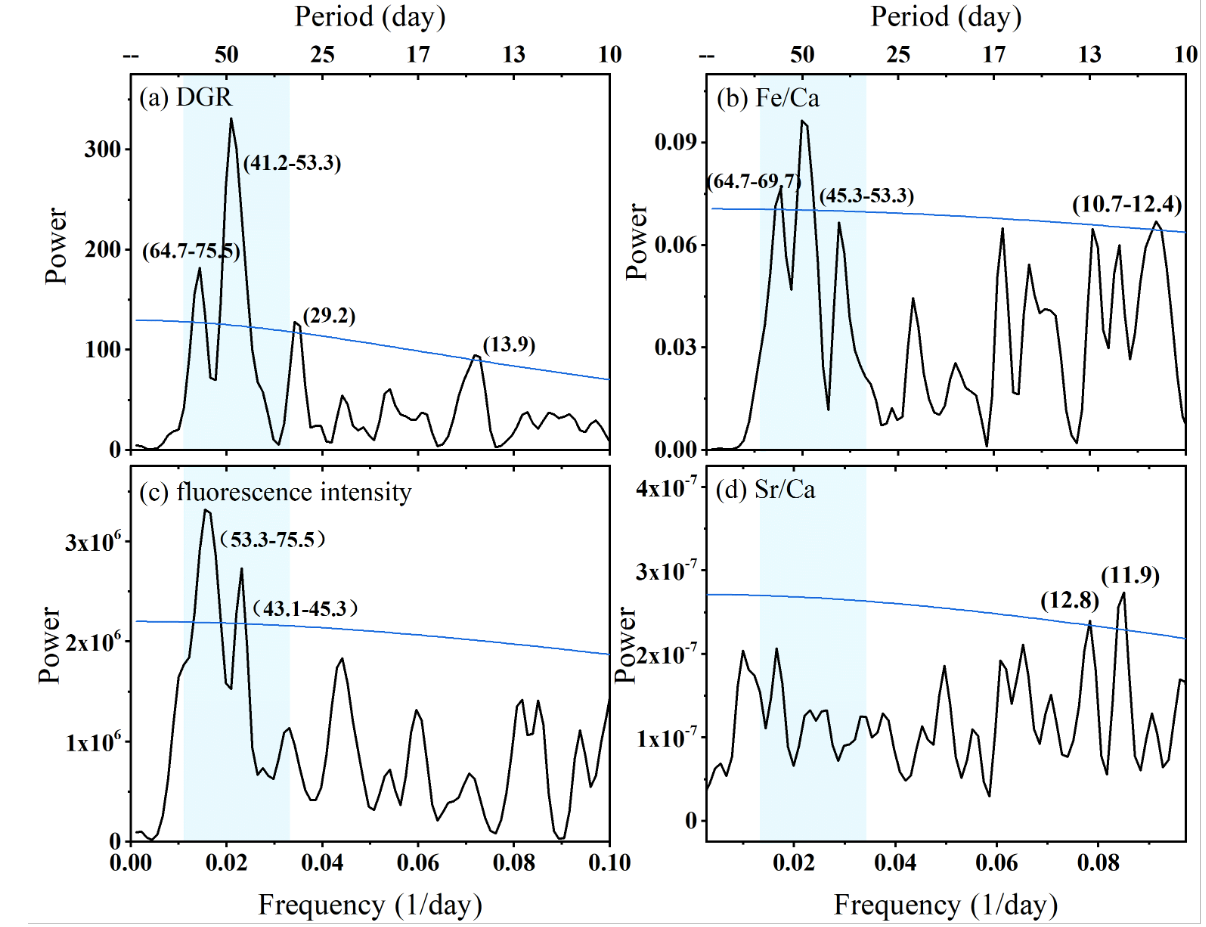
Fig.2 MJO periodic signals recorded in biogeochemical proxy records of Tridacna deresa XB10 during the 2012 and 2013. Spectral densities for (a) daily growth rate, (b) Fe/Ca, (c) fluorescence intensity and (d) Sr/Ca time series. A high-pass filter (100 days) was performed on each time series before spectral analyses in order to remove the low-frequency (seasonal to annual) variability in the records. Periodicities in days are given at top abscissas. Vertical shading roughly encompasses range of the spectral power of MJO. Significant spectral peaks in each panel are indicated in parentheses (units: day). Blue lines indicate a significance of 95%. (Imaged by YAN Hong, et al)
Related downloads:No Download attachments